
Benefits
of Applying Moldiness Index Abound
Dr. King-Teh Lin
Laboratory Director, Mycometrics, LLC, Monmouth Junction,
NJ
Despite molds in the indoor environment having been a growing
public concern, there have been no standardized, objective methods available to
quantify the indoor mold burden in homes.
I believe this situation has now been corrected with the development of mold-specific
quantitative polymerase chain reaction or MSQPCR, and its application called
the Environmental Relative Moldiness Index.
MSQPCR is an objective, standardized DNA-based method of
mold analysis developed by U.S. Environmental Protection Agency scientists to
identify and quantify molds (US Patent No.6,387,652). In 2006, the Department of Housing and Urban
Development (HUD) used this technology to complete the American Healthy Homes
Survey (AHHS). Based on this national
survey and MSQPCR, analysis of the settled dust in the homes in locations
across the
In the AHHS, dust was collected in 1,096
homes by vacuuming two square meters in the living room and bedroom for 5
minutes each with a dust sampler-fitted vacuum. This is approximately 18 square
feet in each room. Each sample was then
mixed and sieved through a 300-micron pore, nylon mesh screen. The samples were analyzed by an EPA licensed
laboratory for 36 indicator species of molds.
What is the ERMI?
The 36 indicator species that make up the ERMI were chosen
because they can be found at relatively high concentrations in homes throughout
the
As shown in Table 1, these 36 species were categorized into
two groups. The first group (Group 1) includes
26 species/clusters associated with water-damaged homes. The other group (Group 2) is comprised of 10
common species/clusters not specific to water-damaged homes. In the AHHS, the ERMI was computed for each
home by taking the sum of the log-transformed concentrations of each of the
Group 1 molds minus the sum of the log-transformed concentrations of the Group
2 molds. (The concentration of the Group 2 species is subtracted from the Group
1 species in order to adjust for variations in cleaning habits.)
|
ERMI Report |
|||
|
Group 1 |
Fungal ID \ Unit |
House A |
House B |
|
Spore E./mg |
Spore E./mg |
||
|
Aspergillus flavus/oryzae |
ND |
ND |
|
|
Aspergillus fumigatus |
ND |
1 |
|
|
Aspergillus |
ND |
2 |
|
|
Aspergillus ochraceus |
5 |
9 |
|
|
Aspergillus penicillioides |
4 |
730 |
|
|
Aspergillus restrictus* |
ND |
ND |
|
|
Aspergillus sclerotiorum |
ND |
ND |
|
|
Aspergillus sydowii |
ND |
<1 |
|
|
Aspergillus unquis |
ND |
8 |
|
|
Aspergillus versicolor |
ND |
530 |
|
|
Aureobasidium pullulans |
680 |
390 |
|
|
Chaetomium globosum |
ND |
ND |
|
|
Cladosporium sphaerospermum
|
7 |
26 |
|
|
Eurotium (Asp.)
amstelodami* |
1 |
150 |
|
|
Paecilomyces variotii |
ND |
ND |
|
|
Penicillium brevicompactum |
ND |
170 |
|
|
Penicillium corylophilum |
ND |
74 |
|
|
Penicillium crustosum* |
ND |
29 |
|
|
Penicillium purpurogenum |
ND |
ND |
|
|
Penicillium spinulosum* |
ND |
1 |
|
|
Penicillium variabile |
ND |
3 |
|
|
Scopulariopsis
brevicaulis/fusca |
ND |
ND |
|
|
Scopulariopsis chartarum |
ND |
4 |
|
|
Stachybotrys chartarum |
ND |
140 |
|
|
Trichoderma viride* |
ND |
<1 |
|
|
Wallemia sebi |
ND |
460 |
|
|
Sum of Logs (Group 1): |
4.98 |
25.36 |
|
|
Group 2 |
Acremonium strictum |
ND |
ND |
|
Alternaria alternata |
2 |
14 |
|
|
Aspergillus ustus |
ND |
58 |
|
|
Cladosporium
cladosporioides 1 |
11 |
350 |
|
|
Cladosporium
cladosporioides 2 |
<1 |
2 |
|
|
Cladosporium herbarum |
8 |
100 |
|
|
Epicoccum nigrum |
14 |
350 |
|
|
Mucor amphibiorum* |
ND |
8 |
|
|
Penicillium chrysogenum |
ND |
17 |
|
|
Rhizopus stolonifer |
ND |
ND |
|
|
Sum of Logs (Group 2): |
3.39 |
12.42 |
|
|
ERMI (Group 1 - Group 2): |
1.59 |
12.94 |
|
|
Table 1: This
sample ERMI report shows how measurements of 36 mold species in two houses
are compared. |
|||
To produce the ERMI scale, the computed ERMI values for all
1096 homes were assembled on a continuum from lowest to highest. The scale ranges from about –10 to about 20,
or even higher, as shown in Figure 1.
On the left hand side of the scale, the 25 percent of homes with the
lowest concentrations of molds in the ERMI analysis have an ERMI value less
than – 4. Homes within this low range
have the lowest mold burden. The homes
in upper quartile have ERMI values of five or higher. Generally homes within
this high range are considered to have the highest potential risk of exposure
to molds associated with water-damaged indoor environments.
The ERMI scale is not meant as a method of making fine
separations, since the standard deviation for any ERMI value is plus or minus
3. For example, the 95% confidence
interval for an ERMI of 14 would be from 11 to 17 – i.e., 14 plus or minus
3. So, for example, an ERMI value of 14
is not significantly different from an ERMI value of 15, or an ERMI of two
versus zero.
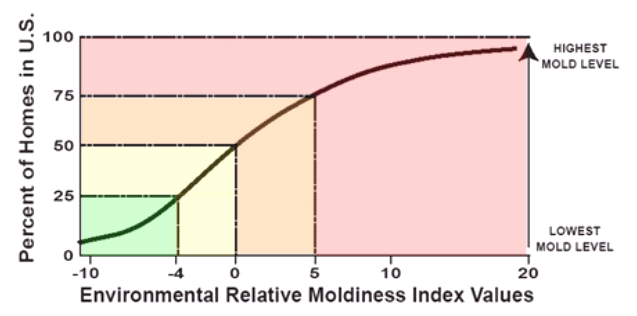
Figure
1: The environmental relative moldiness index,
or ERMI, is the application of mold-specific quantitative polymerase chain
reaction, or MSQPCR.
Using the ERMI for
medical questions
The
ERMI scale was derived from the analysis of the settled dust in the common
living room plus one bedroom of a home; for proper comparison with the AHHS
data, the ERMI samples should be taken in these same areas. However, dust samples can be taken anywhere
for analysis and the inspector’s expertise should direct that. There
is just more uncertainty as one moves away from the locations that were used to
build the ERMI scale. Here are some
examples of how the ERMI is being used.
“If a
person is not feeling well and her/his doctor has determined that sensitivity
to mold is an issue to explore, then an ERMI analysis of the patient’s home is
a good place to start.” explained Dr. Ritchie Shoemaker, a Family Practice
physician in Maryland who specializes in mold exposures. While the ERMI is a mold index and not a
health index, Shoemaker said that whenever the ERMI is elevated, “you may
suspect mold trouble”. If the ERMI is
low and there are people in the home with a typical mold illness, consider
repeating the ERMI in different areas.
If the ERMI is low and no one is ill, your sense of security
increases.
An ERMI
analysis might help you to determine if your home is safe for visitors who
might have a genetic susceptibility to mold.
“If the ERMI value [is above five, which] suggests the home is in the
upper 25% of the scale, then an investigation for water damage could be
health-saving.” Dr. Shoemaker.
He
tells of “a
The
For example, a study conducted of asthmatic
children in
Using the ERMI to
locate mold problems
Derrick A. Denis, a Council-Certified Indoor Environmental
Consultant in
“Some caution in the use of ERMI is necessary because of
conditions that can affect the outcome of sampling,” advised Greg Boothe, a
Certified Industrial Hygienist in Tennessee, who uses ERMI as an effective
screening tool to direct further investigation in both residential and commercial
settings. “Investigators must consider
the condition and activities related to the sampling surfaces in areas selected
for ERMI analysis,” according to Mr. Boothe.
New carpet and carpet that has recently been professionally cleaned may
not reflect the true historical burden of mold in the building.
Gil Cormier, a certified industrial hygienist in
Advantages of ERMI
Traditional air sampling has never
been standardized; thus, interpretations of the results are always
problematic. The major problem with
traditional air samples are that they are necessarily of a short duration. Often, air samples are only taken for a few
minutes because the recovery source, whether a Petri dish or a sticky slide, is
quickly over-loaded. However, air
samples can be useful and, if properly taken, they can also be analyzed by
MSQPCR.
Air samples can be useful,
especially in hospitals or in an effort to pin-point the location of a hidden
mold problem, as Steven Vesper and
others note in a 2004 paper published in the Journal of Hospital Infection.
In order to take air samples for MSQPCR analysis, the collection medium
is a 25 or 37 mm diameter polycarbonate filter with either 0.45 or 0.8 micron
pore size. The flow rate can range from
2 to 16 liters per minute. The holder
for the filter can be a button- sampler, cassette, or any other holder suitable
for the filter. Sampling can be
accomplished using either a personal or area sampling pump. The great thing
about MSQPCR analysis is that the filter cannot be overloaded, meaning air
samples can be taken for prolonged periods such as many hours or even
days. But the best part is that you
don’t have to wait days to weeks for your results. However, there is no ERMI scale for air
samples.
Sampling for the ERMI?
Sampling dust for the ERMI analysis
is fairly simple. Start by locating the
most commonly used area in the living room.
Using a tape measure and masking tape, mark a 3-foot by 6-foot sampling area on the floor. If the sample location cannot accommodate a
sample area of these dimensions, adjust the dimensions accordingly. Record
these dimensions and note where you took the sample for later comparison, if
necessary. Next, do the same in the main
bedroom.
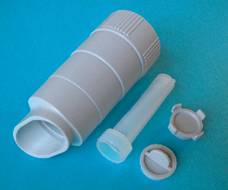
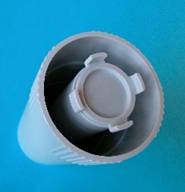
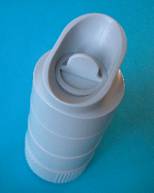
Then take the protective caps off the holder as shown in Figure
2 and insert the filter into the holder and attach it to the vacuum cleaner
hose. Vacuum for 5 minutes in each area,
pull out the sampler and cap it. As a
rule-of-thumb, the filter should be generally about half full when you are
finished. If there is very little dust,
you will want to vacuum for a longer time or over a larger surface area and
note this on the chain-of-custody form.
Send each of the samples in a sealed bag for an ERMI analysis to an
EPA-licensed ERMI laboratory. Your
results can be ready in as little as 24 hours.
|
|
|
|
|
Figure 2: The dust
collector contains a main holder, the caps on either end, and a filter
insert. |
||
If the ERMI value is high, then you may want to analyze
other areas in order to help find the water damage that is the source of the
mold. A basement, if there is one, can
be a common source of water-damage molds and a sample can be taken there. However, once it is clear that there is
water-damage in the environment, other devices like infra-red cameras or
moisture meters or even mold-sniffing dogs may help to locate the problem.
When evaluating buildings other than homes, the difficulty
is deciding where to take samples. It
may be that multiple samples will be required.
The experienced inspector will look at the HVAC system and make an
educated guess about where to sample.
One should take dust samples of an area equivalent to that used in the
home investigation. Collecting dust from
other available surface areas such as a shelf, cabinet, etc with available
settled dust can be an alternative, if no appropriate floor surface is
available.
Since no ERMI scale has been developed for other types of
buildings, one can only relate the analysis back to the home ERMI. Thus an office with an ERMI of 14 would be
like saying the office environment would be equivalent to a home in the top 25%
of homes in the United Sates for relative mold burden. Additional samples, even air samples, may
help pin-point the mold’s location.
Another time to use the ERMI is before and after remediation. After fixing the water problem and removing
the mold contaminated materials, it is important that the entire home be
thoroughly cleaned. You can then repeat
the ERMI sampling and analysis to ensure “post abatement verification”. There should be a significant reduction in
the ERMI value. However, it may take
some weeks to months before the ERMI returns to pre-water-damaged mold
levels.
No sampling can replace the wisdom of experience in finding
and dealing with mold problems in buildings and ERMI can be a helpful
tool. As further research documents the
ERMI’s applications, it can improve lives.
Summary
We know that all indoor environments contain some mold, but not all contain the same molds and
definitely not at the same concentrations.
Identification and accurate quantitation of indoor molds to the species
level is now available using a
King-Teh Lin is Laboratory Director for Mycometrics, LLC. He
earned a doctorate degree from
References
1. Vesper SJ, et
al., J. Occup. Environ. Med. 48,
852 (2006).
2. Vesper
SJ, et al., J. Occup. Environ. Med. 46,
596 (2004).
3. Meklin T, et
al., J. Environ. Monitor. 6, 615 (2004).
4.
5. Morrison
J, et al., J. Hospital infection. 57, 85 (2004).
6. Kercsmar CM, et al., Environ. Health Perspect. 114,1574
(2006).
7. Vesper SJ, et
al., J Exposure Anal. Environ.
Epidemiol. 17, 88 (2007).
This article
is published by Indoor Environment Connections, Page 31-24, 43, Volume 8, Issue
8, June 2007. For additional information, references and assistances, contact
Mycometrics LLC by fax at 732-658-5185, by telephone at 732-355-9018, or
email: quest@mycometrics.com.
©All rights
reserved. Published date: